Innovative Trading Solutions

Custom algorithmic strategies and automation tools for traders and investors to enhance performance.

Algorithm Development Services
A digital stock trading interface with the focus on AMC Entertainment Holdings, Inc. The screen displays various financial data including stock prices, volume, and market cap. A red line graph shows stock performance over time and several buttons allow for different time frame selections like 1W, 1M, and 1Y. Various stock metrics appear in rows and columns.

Tailored algorithms to optimize your trading strategies and improve decision-making processes.

A person is working on a laptop displaying a cryptocurrency price chart. A newspaper is placed on the wooden table next to a cup of coffee, a notebook, and a pen.
A laptop displaying a stock market graph with a rising trend is placed on a desk. Next to the laptop are several books stacked on each other, with titles related to investing. A mouse is positioned to the right of the laptop.
Automation Tools

Advanced automation tools designed to streamline trading processes and maximize efficiency.

Expert Consultation Services

Consult for building one for your own

Algorithmic Trading

We create customized strategies to automate your trading with innovation.
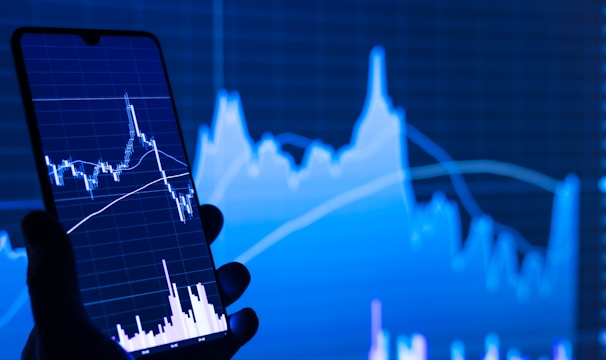
A hand holds a smartphone displaying a financial chart with candlestick patterns. In the background, a large, similar financial graph is visible on a screen, featuring fluctuating lines and data points.
Innovative Solutions

Our team develops cutting-edge tools that enhance trading efficiency and accuracy for investors seeking to optimize their algorithms and automate their strategies effectively.

A person is sitting at a wooden table, looking at a smartphone and a laptop. Both screens display stock market charts and data. The person is holding the phone in one hand while the other hand rests on the laptop keyboard.
Tech Expertise

Leveraging expert knowledge in fintech, we craft automation tools that empower traders to realize their ideas through strategic technology and innovative solutions suited to market demands.

Trading Automation

Innovative strategies and tools for modern algorithmic trading success.

A hand holding a smartphone displaying a cryptocurrency trading application. The screen shows a candlestick chart for BTC/BUSD with a price of 36,437.00, as well as other information like the order book, market history, and margin data. The background has a two-tone color scheme with blue on the left and light gray on the right. The person is wearing a pinkish-red long-sleeve shirt.
A smartphone is placed on a white desk showing a stock trading app with a line graph and financial details. Next to the phone is the keyboard of a laptop, and a white cup is in the top left corner.
A person holds a smartphone displaying a financial or stock trading app, with detailed graphs and numerical data visible on the screen. In the background, there is a blurred computer monitor and office setting, suggesting a work environment.
A person is sitting at a wooden table using a laptop and a smartphone. Both devices display stock charts and market data, suggesting activities related to financial analysis or trading. The room is softly lit, possibly with a Christmas tree in the background.